First Portfolio: Product Sales Analysis with PowerBI
Personal experience from the Side Hustle Data Analytics Bootcamp Cohort 6.0
Last week, after successful onboarding for the Side Hustle Bootcamp. I was assigned alongside other team members into an 8-member group.
Our first assignment was to do a product sales analysis using MS Excel and PowerBI. We were assigned the task of sourcing for dataset, scrape data, cleaning and visualize with MS Excel and PowerBI. Our dataset was sourced from Kaggle.
The data was then transformed using Power Query. Transformation involved changing data types across columns, removing duplicate values, removing and adding columns. 'Date' column was added which was a combination of the 'Day', 'Month' and 'Year' columns in the dataset.
Dataset was loaded into PowerBI editor. Next, we used DAX function to compute measures (Key Performance Indices). KPIs computed included: Total revenue, Total profit, Total cost, Total quantity sold and total product sold.
Data was then visualized using various charts.
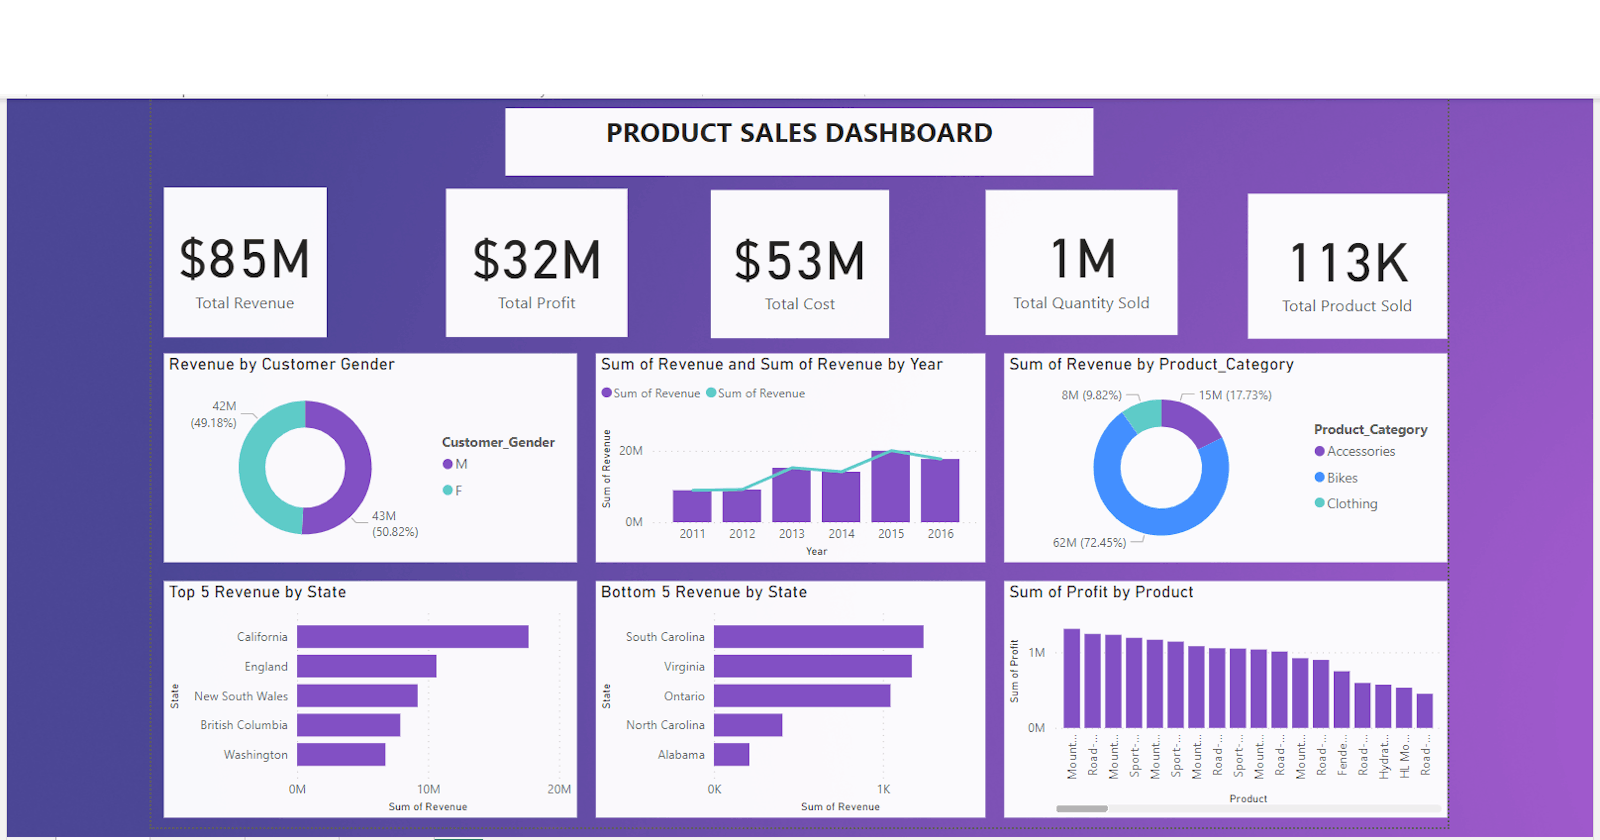
Image of product sales dashboard is seen above.
From 2011 to 2016, a total amount of $85 million was generated. Also a total profit of $32 million was made from 113000 orders. The total quantity of product sold grossed at 1 million.
From the first chart, it can be seen that there was an almost equal distribution of revenue based on gender. With male customers generating 50.82% of total revenue and female generating 49.18%.
In the second chart, we see an uptrend in revenue from 2011 to 2016. An uninterrupted increase in revenue is seen from 2011 to 2013, a short decline is seen from 2013 to 2014 and from 2015 to 2016. 2015 saw the highest revenue generated ($20 million) while the lowest revenue was in 2011($9 million)
The third chart shows the revenue generated across the three product category: accessories, bikes and clothing. Bikes sales generated the highest revenue ($62million) followed by accessories ($15million) and clothing ($8million).
The forth and fifth chart shows the top five revenue generated and bottom five revenue generated based on state respectively.
Customers from California generated the highest revenue ($18million) while the least revenue was from Alabama ($210).
In the last chart, Mountain-200 Black generated the most profit ($3million) The least gains was made from Mountain-500 Black ($7,487).
In summary, in the five-year sales period from 2011 to 2016:
1. There was an upward trend in revenue generated.
2. There was a relatively equal distribution of revenue generated between male and female customers. Male customers had the highest share.
3. Customers from California generated the highest revenue.
4. Bikes product category generated the highest revenue.
5. Mountain-200 Black was the product with the highest profit made.
To bring this article to a close, I want specially thank my team lead Jane Ijay and assistant team lead Ridwan Akinwande for making this project a success. Same goes to my fellow team members.
I can't wait to begin working again with my team members on the next project. This time we will take it a notch higher.
Unto the next chapter...
